

Next: Lateral Static Push Response Up: Unanchored Tank Response Previous: Effect of Base Plate
Table 5.10: Response of Unanchored Tanks Subjected to Northridge Vertical Record - Large Deflection Assumption| Response Parameter | Broad | Tall | | Top Lateral Acceleration | 1.64g | 0.82 g | | Top Lateral Deflection (in) | 1.31 | 8.70 | | Total OTM / WR | 0.193 | 0.461 | | Wall OTM / WR | 0.059 | 0.358 | | Base Shear / W | 0.234 | 0.278 | | Base Axial Stress (Ksi) | -1.65 | -6.64 | | Axial Stress at 0.25H (Ksi) | -0.84 | -4.73 | | Hoop Stress at 0.25H (Ksi) | 19.13 | 12.58 | | Maximum Uplift Displacement (in) | 0.60 | 2.55 | | Minimum Contact Area | 0.793 | 0.610 |
|
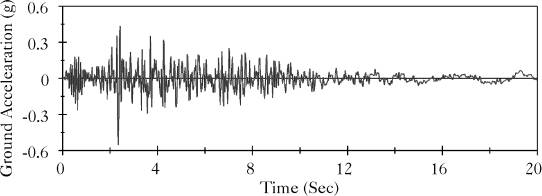
In order to assess the effect of the vertical component of an earthquake excitation on the response of unanchored liquid storage tanks, both broad and tall tanks were subjected to the vertical component of the Northridge Record that has a peak ground acceleration of 0.552 g, as shown in Figure (5.27). Table (5.10) shows the maximum response when the broad and tall tanks were subjected to the vertical component of the Northridge earthquake in addition to the horizontal component. Apparently vertical component altered the hydrodynamic forces exerted on unanchored tanks. If the peak response of the vertical component of an earthquake occurred simultaneously and in the same direction with the peak response of the horizontal component, it may significantly increase the exerted hydrodynamic forces excerted on the tank. Tables (5.11) and (5.12) summarize the effect of the aforementioned factors on the response of broad and tall liquid storage tanks, respectively.
Table 5.11: Maximum Response Summary of the Broad Unanchored Tank| | Base Axial Stress (Ksi) | Max. Uplift Displ. (in) | Total OTM/WR | Base Shear/W | | | | Anchored | El Cen. | -2.03 | - | 0.148 | 0.214 | | Northr. | -2.11 | - | 0.176 | 0.254 | | U n a n c h o r e d | Small Deflection | El Cen. | -4.75 | 1.05 | 0.200 | 0.292 | | Northr. | -4.62 | 1.50 | 0.198 | 0.258 | | Softer Foundation | El Cen. | -2.41 | 1.58 | 0.161 | 0.224 | | Northr. | -1.92 | 1.90 | 0.200 | 0.227 | | Large Deflection | El Cen. | -1.68 | 0.36 | 0.127 | 0.183 | | Northr. | -1.79 | 0.46 | 0.167 | 0.237 | | Plasticity | El Cen. | -2.75 | 1.22 | 0.118 | 0.148 | | Northr. | -1.86 | 0.52 | 0.154 | 0.218 | | Plate Thick. is 0.5 inch | El Cen. | -1.64 | 0.46 | 0.104 | 0.147 | | Northr. | -2.36 | 0.73 | 0.156 | 0.214 | | Vl. Excit. | Northr. | -1.65 | 0.60 | 0.193 | 0.234 |
|
Table 5.12: Maximum Response Summary of the Tall Unanchored Tank| | Base Axial Stress (Ksi) | Max. Uplift Displ. (in) | Total OTM/WR | Base Shear/W | | | | Anchored | El Cen. | -5.77 | - | 0.605 | 0.377 | | | Northr. | -9.10 | - | 0.943 | 0.577 | | U n a n c h o r e d | Small Deflection | El Cen. | -6.71 | 1.75 | 0.380 | 0.243 | | Northr. | -7.90 | 2.87 | 0.477 | 0.293 | | Softer Foundation | El Cen. | -4.52 | 1.74 | 0.228 | 0.144 | | Northr. | -4.50 | 3.60 | 0.277 | 0.220 | | Large Deflection | El Cen. | -6.55 | 1.56 | 0.374 | 0.232 | | Northr. | -6.50 | 2.52 | 0.470 | 0.291 | | Plasticity | El Cen. | -5.43 | 1.73 | 0.305 | 0.185 | | Northr. | -6.74 | 3.13 | 0.394 | 0.254 | | Plate Thick. is 0.5 inch | El Cen. | -7.03 | 1.71 | 0.358 | 0.220 | | Northr. | -7.40 | 2.96 | 0.430 | 0.288 | | Vl. Excit. | Northr. | -6.64 | 2.55 | 0.461 | 0.278 |
|
Figure 5.27: Northridge Earthquake Record Measured at Arleta Site in the Vertical Direction |


Next: Lateral Static Push Response Up: Unanchored Tank Response Previous: Effect of Base Plate A. Zeiny
2000-09-06 