Department of Civil & Geomatics Engineering & Construction
Prepared by:
A. Zeiny, Ph.D., P.E. and J. Larralde, Ph.D., P.E.
August 2000
Abstract
A pioneer technique to repair un-reinforced brick walls cracked during past seismic events, or to retrofit existing brick walls to meet the current code requirements is subjected to experimental investigation. Such walls are very common in historical buildings. The walls are injected by expansive epoxy, known as Bisfoam-3. After the material is shot into walls, it expands, bonds and hardens. This injection technique does not affect the appearance of these historical walls and consequently it preserves their historical value. The investigation consists of testing the seismic performance and ductility of the plain brick walls first. Then, those broken walls are repaired using the foam and tested. In addition, another set of walls that has not been broken first are strengthened with foam and tested. Performance of all walls is studied and compared to prove the effectiveness of the foam material in the retrofitting and repairing of brick walls.
1. Introduction
Epoxy materials have been used in the past in the preservation of old masonry systems including brick masonry buildings. For the most part, the traditional technique consists of applying epoxy to seal the porosity of the masonry units or to make the masonry more watertight and therefore more resistant to the effects of the environment. To a lesser extent epoxy has been used to restore the strength of masonry systems. In the project reported herein, a new type of epoxy formulation produced by Delta Plastics Company, called Bisfoam-3, was tested to determine its potential for structural retrofitting and strengthening of existing brick masonry buildings.
The Delta Plastics Co. Bisfoam-3 is simple to explain. Bisfoam-3 is a monolithic complex composite. This composite material, when injected into a void area within the walls of buildings increases the ductility, damping and strength of these walls. Without this material inside the wall, catastrophic failure is the norm in case of major seismic events.
This report presents the results from the laboratory testing of four brick wall in the structural lab of California State University, Fresno. The size of walls is 10 ft by 10 ft by 10 inch thickness with 2 inches void in between and they are fabricated using aged brick and masonry mortar to simulate the conditions existing in old brick buildings. Two walls were loaded directly as plain, un-reinforced brick wall and results were obtained. The other two walls, identical to the first ones, were first injected with the foam material, allowed to cure for seven days and then tested under similar support and loading conditions. After the plain walls were loaded beyond their full cracked state, they were also repaired with the foam material and re-tested. The results of the tests demonstrate the feasibility and potential of the technique to restore the type of structures and demonstrate the potential for earthquake retrofitting or strengthening.
2. Historical Background
A considerable number of un-reinforced brick masonry buildings were built throughout the world in the past and now they constitute an irreplaceable historical asset for civilization. These structures were built following construction techniques different from the current ones and were built to minimal or no construction codes. In the west coast of the United States, a good number of these types of buildings were built during the 18th and 19th centuries following the techniques of the time. Coincidentally, the great majority of these structures are on, or near zones of high seismic activity. That many have survived the numerous earthquakes since their construction is a proof of the quality of workmanship with which they were built. However, so many of these historical buildings are of incalculable aesthetic and historical value and it is not appropriate to leave their preservation dependant to their good luck. Various strengthening and retrofitting techniques have been used through the years, including more recently the used of high strength fiber composite materials (Hamid et al. 1993, Bhende and Ovadia 1994, Keheo 1996, Ehsani and Saadatmsnesh 1996, Velazquez-Dimas et al. 1999). Also, epoxy injection and consolidation started to be used in the 1960’s in Poland Domaslowsy and Strzelczyk 1986) and 1970’s in the United States (Gauri and Madiraju 1978). Although the main focus of epoxy repair or conservation has been geared towards the sealing of the porosity or cracks in stone, brick, and mortar materials, to protect them against the weather effects, there has always been a desired to provide also structural enhancing with the epoxy.
In 1971, the technology of FR-4 was developed specifically for the rehabilitation of the Los Angeles City Hall building, see Figure 1 , which was severely damaged in the 1971 San Fernando earthquake. The FR-4 product would be chemically irreproducible after 1976 due to the use of Freon as the foaming agent. This technology is now back into chemical production and renamed to Bisfoam-3. The Delta Plastics Co. Bisfoam-3 is now foamed or “blown” by the formation of CO2 instead of Freon, which is a non-regulated method of chemical expansion.
Bisfoam-3 is a functional equivalent to the time tested, in-place exposures of Whittier, Northridge, and all other ground movements as reported by Cal Tech. After better than 30 years of on the job service, the epoxy foam is still in pristine condition and is ever vigilant for the next ground movement. The Delta FR-4 application at the Los Angeles City Hall was accomplished by VTN of Orange County with the assistance of the Army Corps of Engineers, the Office of Emergency Preparedness, better known as FEMA, and the approval of the Los Angeles building department. The Los Angeles City Hall report (Galletti, 1972) outlines extensively the application, building condition, and other methods considered. The 19th method tested was the Delta foam developed by Delta Plastics. The technologies obtained from the restoration of the Los Angeles City Hall along with their engineering and architectural skills made VTN of Orange County a natural choice for the State Capitol building restoration project. The Delta Bisfoam-3, when compared to other types of restoration methods including base isolation technology, is both cost effective and time tested. The Bisfoam-3 epoxy has also been utilized in three applications other than the Los Angeles City Hall, which are Ventura City Hall, Alameda City Hall, and Mayflower Presbyterian Church in Pacific Grove, California in 1999. During three of these projects, the application of the Bisfoam-3 was straightforward. The Mayflower Presbyterian Church application was unique. The church is a single load-bearing wall structure. The approximately 1-2 inch of void area was created many years ago with the use of common plywood and drywall. This application, although altering the interior face of the wall, shows that seismic upgrading can be accomplished with the use of a manufactured confinement area. The application was accepted and now church services have resumed. Void areas will vary and may also be rubble filled. Rubble filled walls may pose the need for extra attention. The Los Angeles City Hall was a rubble-fill-wall application.
3. Construction Procedure
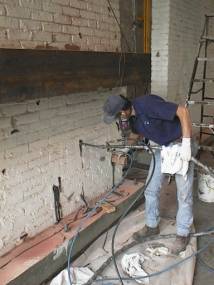
Typical brick walls of historical buildings are made of two layers of brick with 2 inches gap in between to provide insulation. Holes are drilled in the outside bricklayer to reach to the 2-inch gap to pump the expansive epoxy in a liquid form. The holes are drilled in a diamond shape distribution as shown in Figure 2 with 2 feet spacing on center. Expansive epoxy is pumped at about 70°F temperature in the lowest row of holes till it leaks out from neighbor holes showing that this particular section of the wall is full of epoxy as shown in Figure 3 . Then after few minutes, the foam starts to expand and hardens. The estimated expansion ratio for all walls in this test was 1:3.8. The necessary time for the foam to cure is seven days. The method can also be implemented for brick walls with single layer of brick. The approximately 2 inch of void area can be created by the use of common plywood and drywall.
The brick that was used to build the four walls used as test specimens was obtained from the 1900 vintage era. It came from demolished historical buildings. It should be noted that the mortar used to build the walls for this test was according to ASTM standards. In the actual historical buildings, the mortar has deteriorated to the level that it can be easily removed by a pocketknife. In addition, due to the lack of quality control at the time of construction of historical buildings, the variability of the strength of both the brick and the mortar is high. The main concept in this test is to test the plain walls without any foam and establish this as a reference line against which repaired and retrofitted walls are compared. This will clearly point out the improved mechanical properties due to the use of foam. Another immediate advantage of using the foam is that it substitutes for the deteriorated mortar joints. It makes the loose brick wall more monolithic and increases its integrity. In addition, the ductile foam substitutes for the brittle mortar making the wall able to produce much more ductile response in case of seismic ground motions.
4. Test Set-Up
Four walls are built in the structural testing lab at California State University, Fresno. Two walls will be subjected to out-of-plane force and the other two will be subjected to in-plane force, as shown in Figure 4 and Figure 5 . In case of the out-of-plane walls, the axial loading is limited to the own weight of the concrete header beam on the top, the weight of the two steel beams in the middle and the additional weight due to the own weight of the actuator. This adds 3500 lb of additional weight to the wall. This represents the worst-case scenario because increasing the axial load is expected to increase the flexural capacity of the wall. This is attributed to the fact that the wall is much stronger in compression than in tension. The axial load acts like a pre-stressing load where it increases the initial axial compression stress on the wall causing the tension crack to develop at a much higher load.
In the case of in-plane walls, the axial load in the test of the first wall was made of the weight of the concrete header beam and the own weight of the actuator, which is 1900 lb. Such axial load represents the worst-case scenario where a brick wall is supporting one light roof. In the test of the second wall, the axial load was increased by adding two concrete block carried by steel beam from the bottom as shown in Figure 21 . The axial load in this case adds up to 11,000 lb. The objective of this is to explore the change in wall mechanical properties in case of the wall supporting heavier roofs or multiple floors.
5. Presentation of Results
5.1 Out of Plane Wall without Foam
The test was a cyclic displacement control test. The period of one cycle is 10 seconds. The amplitude of the first cycle was 0.01 inches and the increment was 0.01 inch per cycle.
The load deflection curve shown in Figure 6 shows typical hysteresis loops with expected stiffness degradation. The ultimate capacity of the brick wall is 3000 lbs. The wall starts cracking at about 2000 lbs and 0.1-inch deflection. The wall becomes fully cracked at 0.15-inch deflection. Increasing the displacement more than 0.15 inch will cause the wall to deform in a rocking mode where the cracks will simply open and close without providing any resistance. As the deflection started to approach a value of 0.3 inch, the wall starts to show signs of collapsing. The test was then stopped to prevent the wall from going into catastrophic failure where the bottom of the brick wall would slide out of the plane of the wall and the entire wall will then collapse. It was intended from the beginning to just crack the wall to make the idea of repairing the wall and retesting it possible. Two horizontal cracked sections were observed: one right above the horizontal steel beam connected to the actuator and the other was at the bottom of the wall near the foundation. These two cracks separate the wall into three separate pieces; one below the bottom crack, the second is between the bottom and middle cracks and the third is above the middle crack. The wall may then slide out of its plane along these two cracks causing a catastrophic brittle failure.
5.2 Out of Plane Wall Repaired with Foam
The test was a cyclic displacement control test. The period of one cycle was 10 seconds. The amplitude of the first cycle was 0.02 inches and the increment was 0.02 inch per cycle. This test was done in two phases. In phase I, the wall was pushed to a total deflection of one inch. In phase II, the wall was pushed to the full stroke range of actuator, which is plus or minus five inches. Figure 7 and Figure 8 show hysteresis loops for both phases. The wall has reached to a deflection of five inches in both directions without catastrophic failure as shown in Figure 9 . Two horizontal cracked sections were observed: one right above the horizontal steel beam connected to the actuator and the other was at the bottom of the wall near the foundation. At each horizontally cracked section, a plastic hinge was formed with a length equal to the length of the wall. Such ductile plastic hinges were not possible to form without the foam. It is observed that the strength of the wall increased by 24% due to the injection of the foam. This indicates that the injection of the foam not only restored the strength of the cracked wall by sealing all previous cracks, but also increased the strength by 24%. Add to that the added ductility and damping due to the formation of the plastic hinges.
5.3 Out of Plane Wall Retrofitted with Foam
The test was a cyclic displacement control test. The period of one cycle was 10 seconds. The amplitude of the first cycle was 0.01 inches and the increment was 0.01 inch per cycle up to 1 inch of total displacement. After that, the increment was 0.05 inches per cycle. Figure 10 shows typical hysteresis loops with expected stiffness degradation. The ultimate capacity of the retrofitted wall is 4200 lbs. The wall cracked at a section right above the horizontal steel beam connected to the actuator. After cracking, the walls started to deform in a rocking mode where the cracks will simply open and close as shown in Figure 11 . This rocking mechanism was similar to the mechanism developed in the repaired walls.
5.4 Comparison of Results from Foamed Walls with Results from Plain Brick Wall
Figure 7 shows that the ultimate strength of the repaired wall increased to 4500 lbs, which is 1500 lbs more than the plain brick wall. Figure 8 shows that the wall is very ductile because it took a deflection up to five inches without collapsing. This ductility is attributed to the formation of the plastic hinges in the middle and at the bottom of the wall. One may argue that the wall was prevented from catastrophic failure because the actuator laterally braced it. Such an argument is not valid because the load did not reverse sign. In other words, if the wall is prevented from collapsing by the actuator, then the force in the actuator will be tension instead of compression in one direction, or compression instead of tension in the other. But the shown load deflection curve in Figure 8 is showing that up to five inches of deflection, the actuator had to push/pull the wall with a force of 2100 lbs to produce a five inch deflection, i.e. the wall still has a resistance of 2100 lbs at five inches of deflection. If the applied actuator force of 2100 lbs is removed, then the wall will return to a position close to the at rest position. This magnitude of deflection is very ample to prove a very ductile behavior of the originally very brittle brick wall keeping in mind that the maximum deflection that can be produced by the actuator used is plus or minus five inches, i.e. the test was stopped at 5 inches because of the limitations of the testing equipment not because of the wall reaching its ultimate capacity. It was not possible to see such ductile plastic hinges in the wall without the foam. A catastrophic failure would have taken place because the portion of the wall above any of the two horizontal cracks may slide out of the plane of the wall causing the wall to suddenly loose the ability of carrying vertical loads, which means sudden fall down of the floors and/or roofs supported by the wall.
Comparing the load-deflection curve of the retrofitted wall to the repaired wall shows that the load required to form the plastic hinge increases by 20%. Another observation in the retrofitted wall is the sudden drop of load after the formation of the plastic hinge. This sudden drop of load is attributed to the fact that cracking of the brick mortar is brittle failure. In the repaired wall, this crack has already taken place when the wall was initially cracked before the injection of the foam. This explains why we see gradual drop of load with the increase of deflection beyond the formation of the plastic hinges in the repaired wall while a sudden drop of load is observed in the retrofitted wall that has not been cracked before.
5.5 In plane Wall without Foam
The test was a cyclic displacement control test. The period of one cycle was 10 seconds. The amplitude of the first cycle was 0.005 inches and the increment was 0.005 inch per cycle. The vertical load applied on the top of the wall was not symmetric because of the weight of the actuator. Another reason is the uplift of the actuator when the wall is pushed versus no uplift when the wall is pulled. The resistance of the actuator to uplifting is high when the wall is pushed. This mechanism yielded a non-symmetrical hysteresis loops. It was decided to consider only the pulling side of the hysteresis loops because the actuator does not uplift in this case. Figure 12 shows only the pulling side of the hysteresis loops. The pushing side is omitted because it does not represent the pure strength of the wall. The wall failed in tension at horizontal mortar joints near the bottom of the wall as shown in Figure 16 . Horizontal mortar joints near the bottom of the wall have cracked and the portion of the wall above these joints started to uplift and rock in a rigid body motion. The ultimate capacity of the wall was 3860 lb. There were no signs of shear failure.
5.6 In plane Wall Repaired with Foam
The wall that was broken previously without foam was repaired by injecting the foam. The wall is then left for several weeks. After that, the wall is tested in two phases. The first phase was a monotonic test where the wall was pulled to a deflection of 0.25 inch. As shown in Figure 13 , the capacity of the wall has increased from 3860 to 5750 lb, i.e. 49%, as a result of the foam. This relatively large increase in capacity is attributed to the fact that the failure section after injecting the foam has shifted 22 inches towards the bottom of the wall as shown in Figure 16 . This increased the arm of the bending moment inducing the failure as well as increased the size of the portion of the wall above the failure section that has to uplift before the failure can take place. Both factors, the arm of the bending moment and the weight of the uplifted portion of the wall, contribute to the resisting moment.
The second phase was a cyclic displacement control test. The period of one cycle was 10 seconds. The amplitude of the first cycle was 0.02 inches and the increment was 0.02 inch per cycle. This test was done after the wall has developed the failure crack in the monotonic test without any repair. Due to non-symmetrical loading conditions, only the pulling side of the hysteresis loops is shown in Figure 14 .
Figure 15 and Figure 16 show the wall at failure. It was observed that the cracks that opened during the testing of the un-injected wall did close as a result of the foam. In addition, the foam helped in preserving the integrity of the wall by helping the mortar joints in transferring the loads between bricks. Due to the brittle nature of the mortar material, mortar fails first. The foam material is ductile and allows much more deformation before it fails. This allows more energy absorption and dissipation in seismic events. It also increases the damping of the wall, which leads to better seismic performance. After the wall failed in tension cracks at horizontal mortar joints, the part of the wall above cracked mortar joint started to rock in a rigid body motion. There were no signs of shear failure.
5.7 In plane Wall Repaired with Foam and Anchored with Fiberglass
Figure 16 show the failure cracks before and after repairing with foam. The foam sealed the original failure cracks and the wall cracked at a section near the foundation where there is little amount or no foam. As a result, it was decided to repair the wall again for the second time using fiberglass and epoxy. The fiberglass was glued to both wall and foundation to provide anchorage between the wall and its foundation, and to cover the area at the bottom of the wall where there is little amount or no foam. As shown in Figure 17 and Figure 18 , the fiberglass anchorage was installed on one side of the wall only to simulate the real life conditions where only one side of the wall is accessible. The fiberglass has also covered the second failure crack produced due to the testing of the repaired wall.
The wall was then subjected to a cyclic displacement control test that ranges from zero to maximum value. During one cycle, the wall is pulled from the neutral position to a maximum value and then returned back to the neutral position. The wall is not pushed due to the unsymmetrical loading conditions explained before. The period of one cycle was 10 seconds. The amplitude of the first cycle was 0.02 inches and the increment was 0.02 inch per cycle up to 1 inch of total displacement. After that, the increment was 0.1 inch per cycle. Figure 19 shows the hysteresis loops of the wall when subjected to such cyclic excitations. It was observed that the wall has cracked at a horizontal mortar joint section right above the fiberglass as shown in Figure 20 , and the resistance of the wall jumped from 5800 lb to 7000 lb, i.e. 21%. This increase is attributed to the fact that the fiberglass prevented failure at the bottom of the wall where is little or no foam and forced the failure to take place in an area of the wall rich with foaming material.
5.8 In-plane Retrofitted Wall with Foam and Anchored to Foundation
The axial load in the test of the first in-plane wall was made of the weight of the concrete header beam and the own weight of the actuator, which is 190 plf or 2 psi. Such axial load represents the worst-case scenario where a brick wall is supporting one light roof. In the test of the second wall, the axial load was increased by adding two concrete blocks carried by steel beam from the bottom as shown in Figure 21 . The axial load in this case adds up to 1100 plf or 11.5 psi. The objective of this is to explore the change in wall mechanical properties in case of the wall supporting heavier roofs or multiple floors.
5.8.1 Wall is Anchored with Fiberglass Only
The test was a cyclic displacement control test that ranges from zero to maximum value. During one cycle, the wall is pulled from the neutral position to a maximum value and then returned back to the neutral position. The period of one cycle was 20 seconds. The amplitude of the first cycle was 0.01 inches and the increment was 0.01 inch per cycle. The period was increased to 20 seconds instead of 10 seconds to prevent the oscillations of weights hanged from the top of the wall. The test stopped as soon as the tension crack shown in Figure 23 was observed. The load deflection curve shown in Figure 22 indicates that the test was stopped at a deflection of 0.31 inch. It was possible to continue the test beyond this point; however, it was decided to stop the test to install a chain that anchors the wall to the foundation to prevent the tension crack from further progressing.
5.8.2 Wall is Anchored with Fiberglass and Steel Chain
The test was a cyclic displacement control test that ranges from zero to maximum value. During one cycle, the wall is pulled from the neutral position to a maximum value and then returned back to the neutral position. The period of one cycle was 10 seconds. The period was decreased back to 10 seconds because it was found that 10 seconds period is long enough to prevent significant oscillation of the concrete blocks hanging from the wall. The amplitude of the first cycle was 0.05 inches and the increment was 0.05 inch per cycle. The chain was installed as shown in Figure 24 to prevent the tension crack developed from progressing and to force shear failure mechanism. The extra axial load produced by the stretching of the chain simulates the case of a load-bearing wall carrying several floors. In this case, tension cracks are not possible due to the heavy axial load due to the dead and live loads from the supported floors. The chain did not totally prevent the wall from uplifting because the chain was not pre-stressed. The wall had to uplift for some distance to stretch the chain and produce the desired axial load. Figure 25 shows the hysteresis loops until failure of the connection between the wall and foundation. The entire wall has slide for a distance of two inches on its foundation and the foundation itself has cracked as shown in Figure 26 . The wall itself showed no signs of any additional failure than the tension crack produced in the previous test. Before the wall slides, the fiberglass pulled out of foundation due to the uplift of the wall. Such a failure is not expected in real life applications because dead and live loads will apply heavy compression stress on the wall that may reach up to 40 psi or 3850 plf. Such heavy axial load will not make uplifting of the shear wall possible. The real life failure mechanism of brick walls under heavy axial loads is expected to be stair-steps diagonal crack in mortar joints due to the effect of diagonal tension.
Figure 26 also shows a piece of fiberglass pulled out of the wall. It is clear from the picture that the boding strength between the fiberglass and brick wall due to gluing epoxy exceeded the strength of the brick itself. This resulted in a thin layer of brick pulling out of the wall and remaining with the fiberglass. This leads to the conclusion that using such an epoxy in gluing the fiberglass to the brick wall is adequate because it provides bonding resistance, which is more than the shear resistance of the brick itself.
5.8.3 Wall is Laterally Supported by Steel Strut and Anchored with Fiberglass and Steel Chain
The same wall was repaired and tested for the third time. This time, a lateral steel strut was installed at mid height of the wall as shown in Figure 27 to provide lateral support and to prevent the wall from going into further sliding when pulled. Sliding failure is not expected for such walls under heavy axial loadings. The effective loaded portion of the wall is the top half of the wall, which simulates a wall of aspect ratio of 2:1. That portion of the wall was free of any cracks or signs of failure due to the previous two tests. The wall was then subjected to a cyclic displacement control test that ranges from zero to maximum value. During one cycle, the wall is pulled from the neutral position to a maximum value and then returned back to the neutral position. The period of one cycle was 10 seconds. The amplitude of the first cycle was 0.05 inches and the increment was 0.05 inch per cycle. The chain was kept in place to prevent the wall from uplifting and to provide extra axial loading when stretched. First, a curved tension crack was formed as shown in Figure 29 to allow the wall to uplift a little bit to stretch the chain. Such uplifting was necessary for the chain to develop enough axial loading to produce the desired failure mechanism. Then the stair-steps diagonal-tension crack was developed as expected. This failure mechanism is expected in case of brick load-bearing wall supporting heavy axial loads. Figure 28 shows the hysteresis loops until the formation of the stair-steps diagonal crack.
6. Physical Properties of Bisfoam-3
6.1 Fire Resistance
The Delta Epiceramictm Bisfoam-3 A&B is a two component, fast foaming system. The system cures to a low density, rigid closed cell foam with outstanding non-burning properties along with excellent low expansion pressure properties. The tough, rigid, ductile polymer has a flame spread of less than 19 as well as a smoke density of less than 75 and is ablative in nature. The cured foam, when exposed to open flame, will char with little damage to or deformation of the foam structure. The smoke emitted contains decomposition products of carbon, hydrogen, water, and traces of chlorine and fluorine. In addition there is a low odor quality. The Bisfoam-3 A&B fire resistance testing is as follows: MIL-I-16923D, ASTM D568, ASTM D635, ASTM D757, ASTM D1433; passes all tests. The versatility of the epoxy foam polymer allows for large mass foaming and its ease of handling allows for many types of molding applications.
In addition to its fire retardant properties, several other features are displayed by both the uncured and cured foam:
1. The epoxy foam is designed for in-head mixing equipment where fixed ratios are present. This provides the applicator with the ability to place large amounts of product very quickly and reduces labor and material waste.
2. DELTA BISFOAM-3 A&B can be sprayed with currently available foam spray equipment. Chopped fiberglass can be sprayed along with the foam to obtain a glass-reinforced foam.
3. The mixed system foams as a fast, soft rising foam with low internal foaming pressures allowing the foam to be contained into specific areas without excessive pressure being generated. Lab tests indicate a maximum of 2 psi foaming pressure.
4. When the foaming action is complete, the foam is tack free. The elapsed time from start of mixing to tack free is less than 3 minutes at temperatures between 78°F and 82°F in masses of no less than 20 grams.
5. The cured foam has excellent adhesion to a wide variety of materials such as brick and other masonry products as well as lead, zinc, copper, aluminum, iron, tin, some types of polyethylene, polypropylene, kynar, epoxy, polyesters, tile, terra cotta, and marble. The foam also bonds to itself.
6. The cured foam has excellent thermal stability when exposed to open flame and excellent dimensional stability when tested for 160 hours at 300°F
7. The thermal insulating qualities of the cured foam at a 4 pound density show a K factor of .19 BTU/hr/ft²/°F/in.
6.2 Handling Characteristic
Resin (Part A) 100 Parts by Weight
Hardener (Part B) 10 Parts by Weight
It should be noted that both Part A and Part B of this foam system should be stirred thoroughly prior to using to ensure that no separation of ingredients has occurred. The Part A of the foam system should be preheated to a temperature between 78°F and 82°F prior to in-head mixing and maintained at such temperature during injection. The resulting foam density will be a function of the temperature and the mass of the material being foamed.
The foaming action accomplished in a free foaming, unrestricted area will develop a 2.5 to 4 pound density or up to a 10 to1 volume expansion ratio. The foaming action accomplished in a confined will result in an end-foamed product with a higher density. It should be noted that Protective clothing and cleanliness should always be used when working with epoxy resins and hardeners. If skin contact is made, wash the area with soap and water. If the materials get into the eyes, rinse with quantities of water and consult a physician. Use epoxy resins and hardeners only in well ventilated areas and avoid breathing of vapors.
6.3 Curing Characteristic
Property Description Approximate Time
Pot Life, 110 grams, 78-82°F 45-75 seconds
Cream Time 1-2 minutes
Foaming Complete 3 minutes
Tack Free 3.25 minutes
Initial Cure 45 minutes
Full Cure 4 days
6.4 Suggested Storage Procedure
The foam as supplied should be stored at temperatures below 80°F. The shelf life of unopened containers will be a minimum of 1 year. However, separation of the ingredients may occur over a long period of storage.
6.5 Availability of Material
The DELTA EPICERAMICtm BISFOAM-3 A&B is available in the following standard kit sizes where the resin (Part A) is supplied in 5-gallon pails, 1-gallon cans, and 1-quart cans with the proper amount of hardener packaged in an appropriately sized container. The material is packaged at a ratio of 100 parts by weight of resin (Part A) to 10 parts by weight of hardener (Part B).
5-Gallon Kit 1-Gallon Kit 1-Quart Kit
Part A, Weight 40 lbs. 8 lbs. 2 lbs.
Part B, Weight 4 lbs. .8 lbs. . 2 lbs.
7. Ductility of Walls
The seismic design provision of the UBC 1997 and previous editions require the designer to divide the seismic force by a ductility coefficient “R” when calculating the total design base shear for the building. The “R” coefficient for various building systems can be obtained from tables 16-N and 16-P in the UBC 1997. UBC does not provide a value for the system of brick walls injected with foam. However, section 1629.9.2 allows the establishment of “R” value for unlisted systems using cyclic test data and analysis. Our objective in this section is to analyze the test data to obtain a value for the “R” coefficient.
The ductility of the structural element is generally defined as the member’s ability to undergo deformations without a substantial reduction in its load resisting capacity. The ductility can be defined either by the curvature ductility factor or by the displacement ductility factor. The curvature ductility factor is the ratio of the section curvature at ultimate strength to the curvature at the beginning of the nonlinear plastic behavior. The displacement ductility factor is the ratio between the maximum horizontal displacement of the wall at ultimate strength and the maximum horizontal displacement at the beginning of the nonlinear plastic behavior. The second definition is adapted herein. In order to apply this definition, one must determine at what point should we consider the wall at the beginning of the nonlinear plastic behavior and at what point should we consider the wall at its ultimate strength. The following procedure is adapted to determine the point of the beginning of the nonlinear plastic behavior; first, the envelop of the load deflection hysteresis loops is drawn. This envelope represents the traditional load-deflection curve obtained in case of a monotonic test. The slope of this curve at any point represents the stiffness of the wall at that point. The beginning of the nonlinear plastic behavior is considered at the point where there is a significant change in the slope of the load-deflection curve. A different approach is used to determine the point of ultimate strength. In the case of out-of-plane walls, the ultimate strength is considered to be the point at which the line of action of the supported vertical load passes by the overturning point as shown in Figure 30 . If the deflection of the wall is allowed to go beyond this point, then the supported vertical load is going to contribute to the overturning moment instead of the stabilizing moment and the wall may go to the instability condition. Therefore, this constitutes the point of ultimate strength, which is equal to the smaller of the thickness of the two layers w1 or w3. In this test, w1=w3=5 inches and w2=2 inches. Based on these numbers and definitions, the ductility factor is estimated to be ten. Accounting for a factor of safety of two, it is recommended to use an R factor of five.
In the case of in-plane-wall, the point of ultimate strength is observed during the test. It is defined as the point at which the wall lifts significant distance to become unstable, or develops a full stair-step diagonal crack. Based on these definitions, the ductility factor of the wall is estimated to be eight. Accounting for a factor of safety of two, it is recommended to use an R factor of four.
8. Conclusion
The technology of Bisfoam-3 has proved its effectiveness in the repair and retrofit of brick walls used as structural elements in historical buildings. In such brick walls, the mortar has deteriorated to the level that it can be easily removed by a pocketknife. The foam substitutes for the deteriorated mortar joints. It makes the loose brick wall more monolithic and increases its integrity. In addition, the ductile foam substitutes for the function of the brittle mortar making the wall able to produce much more ductile response in case of seismic ground motions. If the mortar joints are not deteriorated, then they will break at very small deflections due to its brittle nature and inability to carry large tension loads. The foam herein works as the second line of defense that will pick up the lost function of the mortar but in a much more ductile fashion allowing a better distribution and transfer of stresses in the wall. Without the foam, a complete catastrophic failure is expected at relatively much smaller deflections.
The foam also has another important function. It provides a passive control of the vibration of the wall by adding additional damping to the system. The increased damping is resulting from the foam material itself in addition to the energy dissipated in the friction between adjacent blocks of brick. The foam allows more ductile response where various blocks of brick will have large relative motion between them and as a result dissipating much more energy.
9. References
· Velazquez-Dimas, J., Ehsani, M.R., and Saadatmanesh, H. (1998), “Cyclic Behavior of Retrofitted URM Walls,” Proceedings, 2nd International Conference on Fiber Composites in Infrastructure, Tucson, Arizona.
Figures and Tables
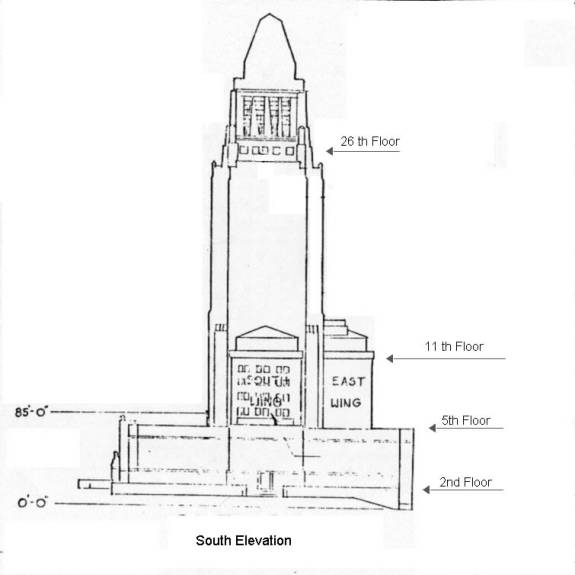
Figure 1: South Elevation of the LA City Hall
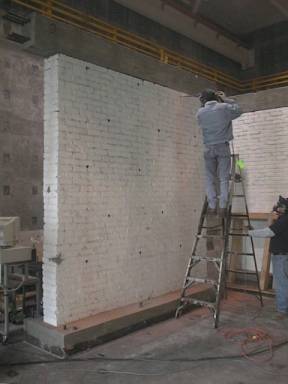
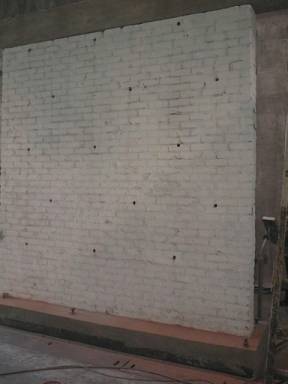
Figure 2: Distribution of Holes on the Wall
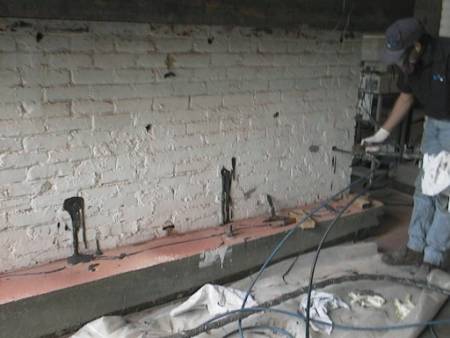
Figure 3: Pumping of Expansive Epoxy in the Wall
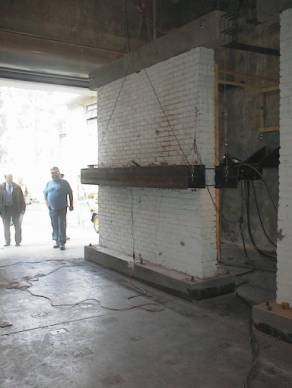
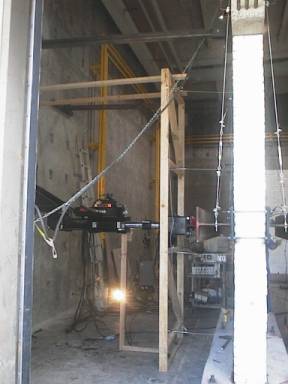
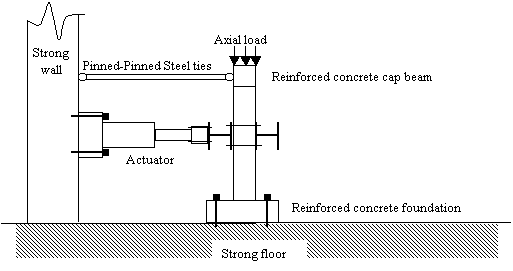
Figure 4: Out-of-plane bending
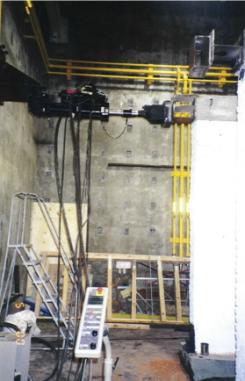
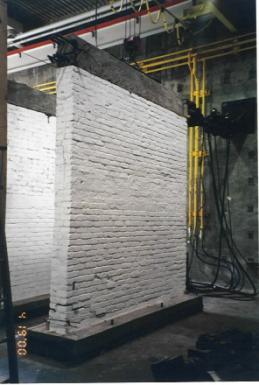
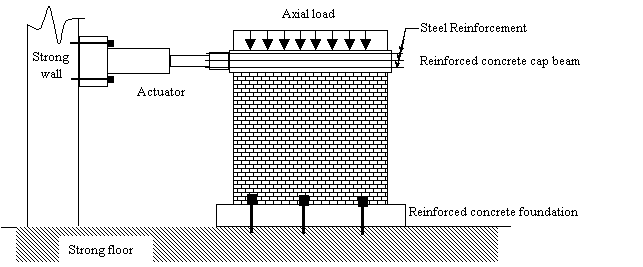
Figure 5: In-plane Shear Test Set-up
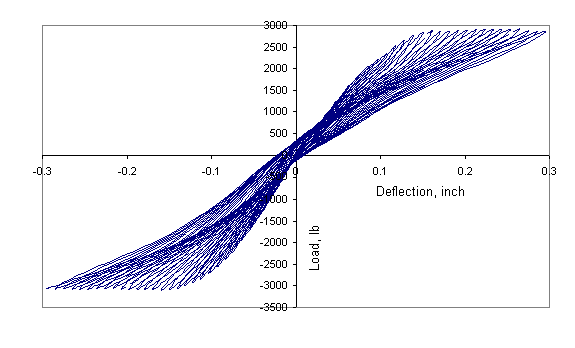
Figure 6: Load-Deflection Curve for Out-of-Plane Loading of Un-Injected Wall
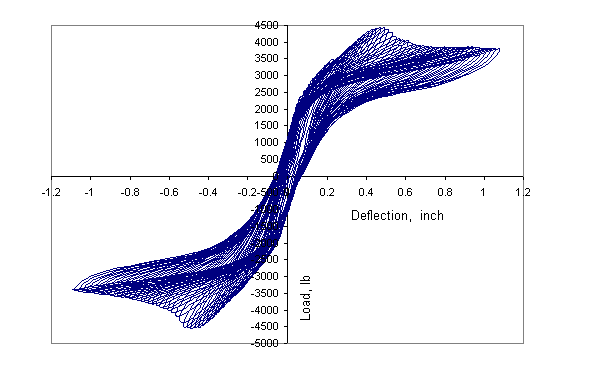
Figure 7: Load Deflection Curve of the Out-of-Plane Repaired Wall (Phase I: Up to 1 inch Deflection)
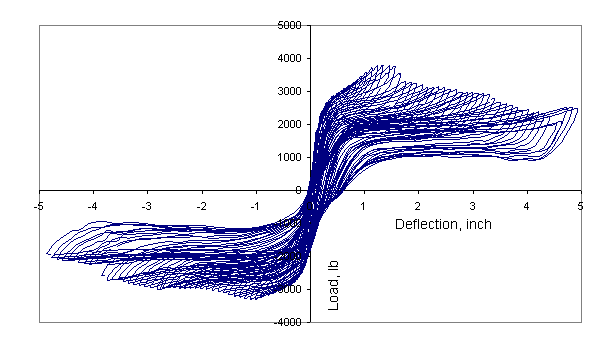
Figure 8: Load-Deflection Curve of the Out-of-Plane Repaired Wall, (Phase II: Full Deflection Range)
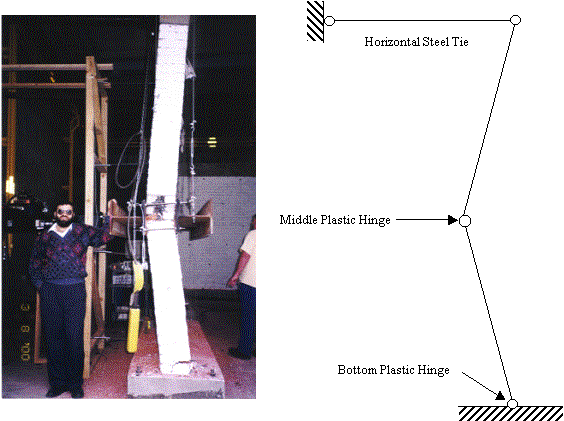 |
Figure 9: Failure Mechanism of the Out-Of-Plane Repaired Wall
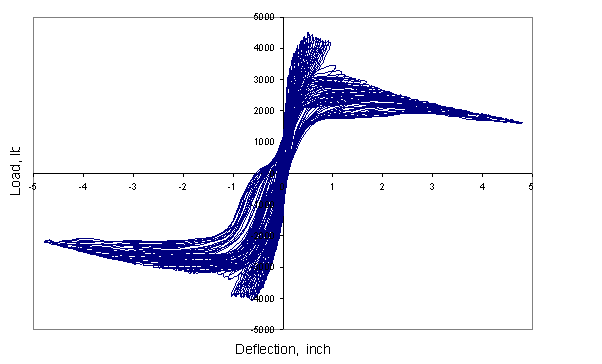
Figure 10: Load-Deflection Curve of the Out-Of-Plane Retrofitted Wall
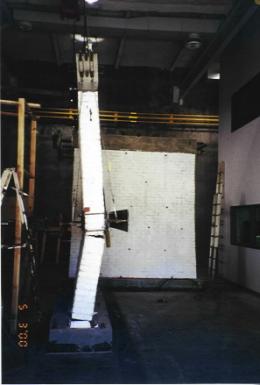
Figure 11: Failure of the Out-Of-Plane Retrofitted Wall
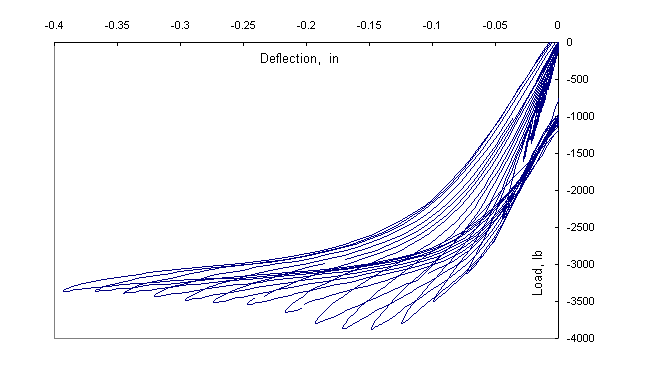
Figure 12: Load-Deflection Curve of the In-Plane Un-Injected Brick Wall
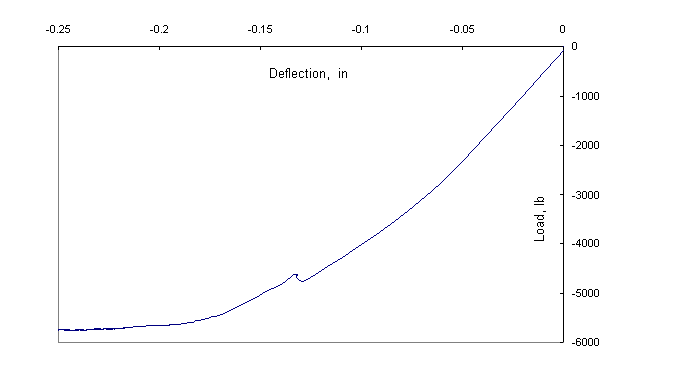
Figure 13: Load-Deflection Curve of the In-Plane Repaired Wall – Phase I: Monotonic
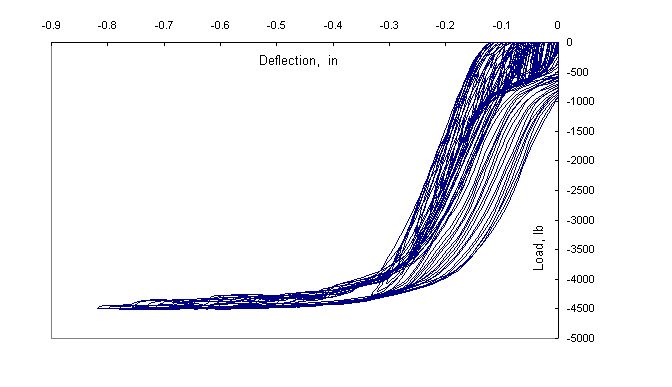
Figure 14: Load-Deflection Curve of the In-Plane Repaired Wall – Phase II: Cyclic
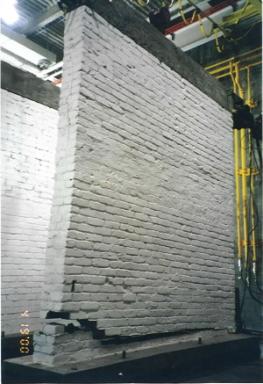
Figure 15: Failure of Repaired In-Plane Brick Wall
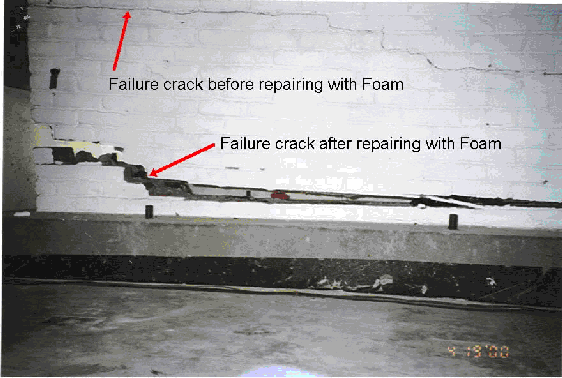
Figure 16: Failure Cracks of the In-Plane Wall Before and After Repairing with Foam
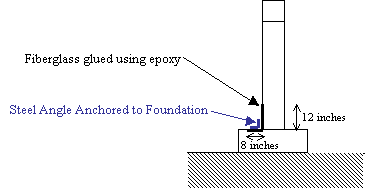
Figure 17: Anchorage of wall to foundation using fiberglass and epoxy
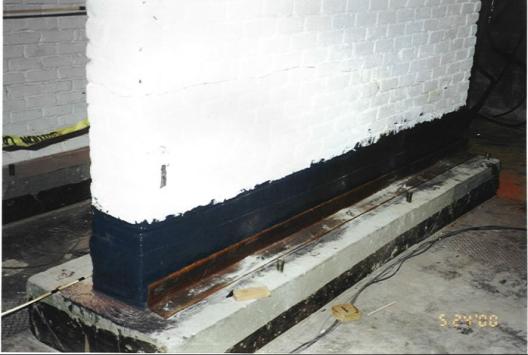
Figure 18: In-Plane Wall Anchored to Foundation with Fiberglass Glued With Epoxy and Steel Angle
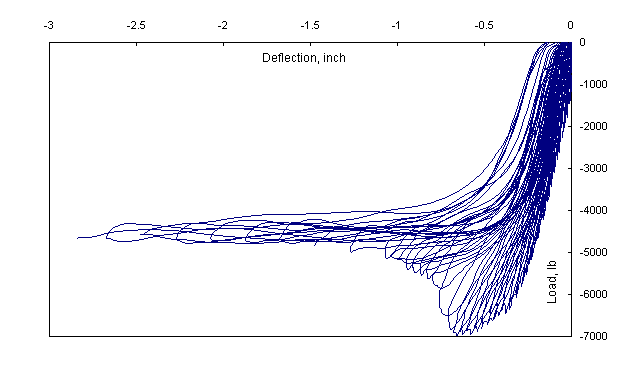
Figure 19: Load-Deflection Curve of the In-Plane Repaired Wall and Anchored to Foundation with Fiberglass
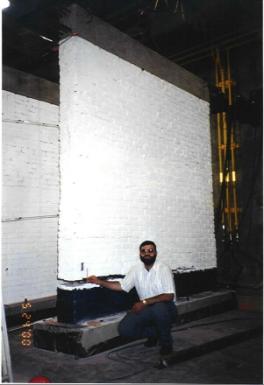
Figure 20: Failure of In-Plane Repaired Wall Anchored to Foundation with Fiberglass
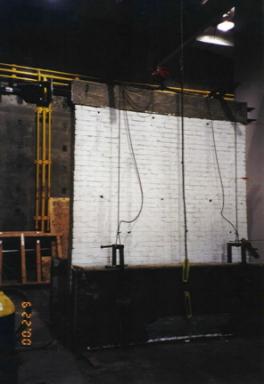
Figure 21: In-Plane Retrofitted Wall with Extra Axial Load and Anchored to Foundation with Fiberglass
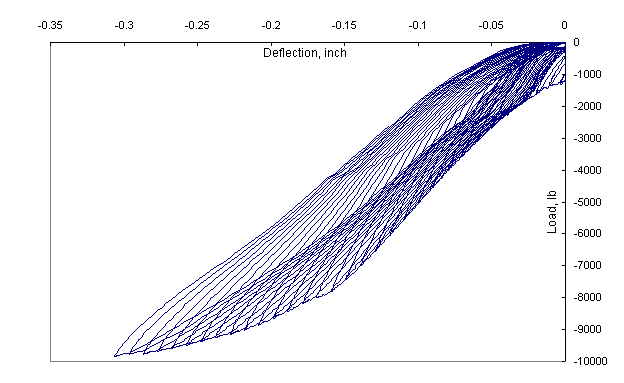
Figure 22: Load-Deflection Curve of the In-Plane Retrofitted Wall with Extra Axial Load and Anchored to Foundation with Fiberglass
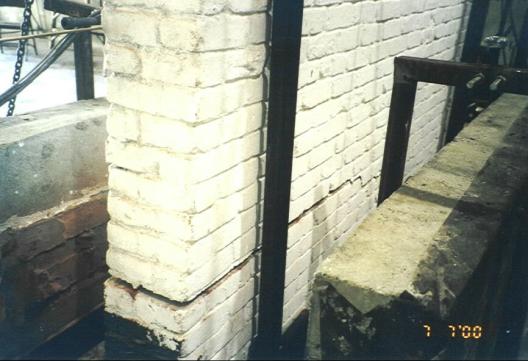
Figure 23: Initial Tension Crack of the In-Plane Retrofitted Wall with Extra Axial Load and Anchored to Foundation with Fiberglass
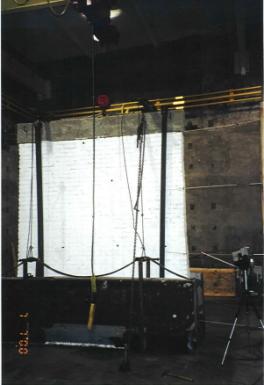
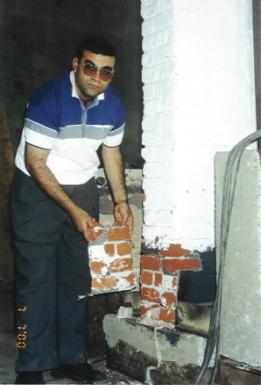
Figure 25: Load-Deflection Curve of the In-Plane Retrofitted Wall with Extra Axial Load and Anchored to Foundation with Fiberglass and Steel Chain
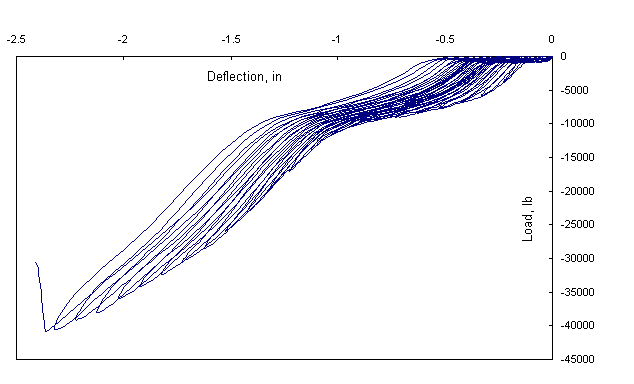
Figure 26: Sliding, Fiberglass and Foundation Failure of the In-Plane Retrofitted Wall with Extra Axial Load and Anchored to Foundation with Fiberglass and Steel Chain
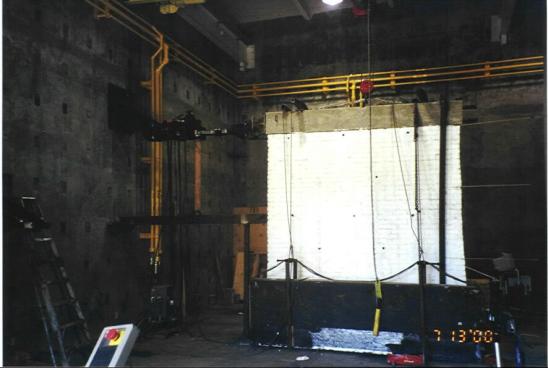
Figure 27: In-Plane Laterally Supported Retrofitted Wall with Extra Axial Load and Anchored to Foundation with Fiberglass and Steel Chain
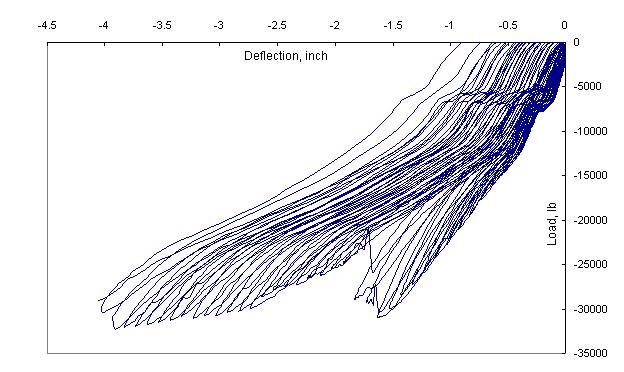
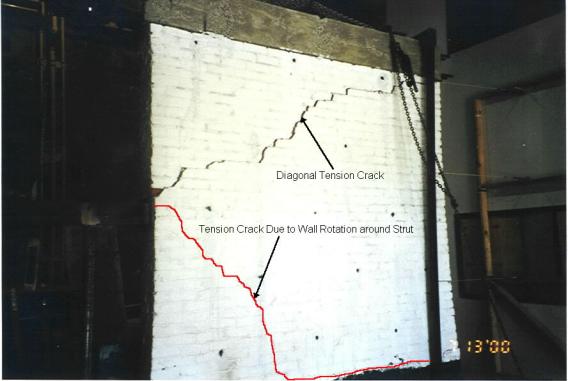
Figure 29: Failure of the In-Plane Laterally Supported Retrofitted Wall with Extra Axial Load and Anchored to Foundation with Fiberglass and Steel Chain
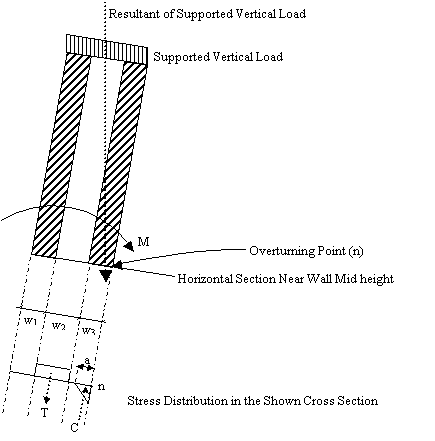
Figure 30: Mechanical Modeling of the Vibration of the Out-Of-Plane Wall